In the following article, we talk about how statistics are used even in the world of sports, as can be seen in the movie Moneyball (2011), where sports teams use statistical data to decide which players to hire for their baseball team.

Last year, the film Moneyball (2011) appeared in theaters, obtaining six Academy Award 2012 nominations. The film is based on the book “Moneyball: the art of winning an unfair game” written in 2003 by Michael Lewis. This book tells the story of the general manager of the Oakland Athletics, Billy Beane, who set a goal to make the best draft picks of players for the 2002 season, with the constraint of a low budget. To make the decisions of hiring players he used analytical strategies based on on-base percentages, leaving aside other criteria and standard methods commonly used.
Through this method Billy Beane led his team to the playoffs for 4 times in a row, and again this year. This past season, the Athletics was the team with the lowest payroll in the major leagues according to ESPN with $52’872,500 (on opening day), compared to $132’276,000 from Detroit (who eliminated Oakland in semifinals) and $200’203,004 from New York –the most expensive team in the league.
With the precedent of the achievements of Billy Beane and his colleagues, other teams in Major League Baseball (MLB) began to pay attention to sabermetrics -the statistical analysis of data generated by MLB. The term comes from the initials of the Society for American Baseball Research (SABR). In general, sabermetrics seeks to maximize the wins, based on the optimization of financial resources through the recruitment of players based on statistics, not in popularity, images or other factors commonly used.
The most known name in the origin of sabermetric ideas, and the person who actually coined the term, is Bill James. James published several editions of articles called “Baseball Abstract,” in which he statistically analyzed the performance of players. The main theme of his articles were the statistics obtained by the players last season. From these publications, the topic began to gain more popularity with baseball fans, players and team owners, generating more literature on this area.
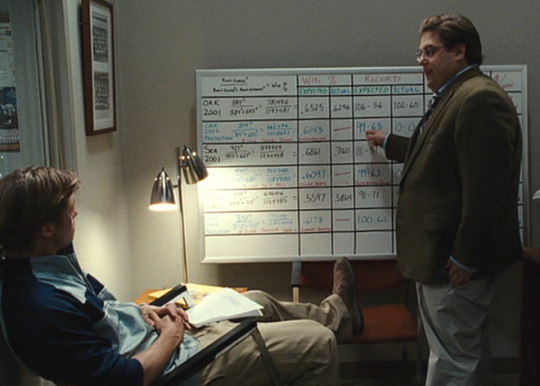 DURING THE MOVIE, CHARACTER PETER BRAND EXPLAINS THE A'S MANAGER, BILLY BEANE, SOME OF THE DATA
To evaluate the performance of the players pitching, batting and fielding statistics are calculated through established formulas for obtaining the percentages of each player. Using mathematical and statistical analysis of historical records of the players, sabermetrics assesses individual and collective measurements obtained from previous games. Thus, that different strategies and combinations of players have on the outcome of these games is determined. This analysis provides combinations of players (with their respective percentages) that allow the team to make a greater number of runs.
Sabermetrics bases its calculations on formulas for pitchers, hitters and defenders. Here are some examples of formulas used for this purpose:
OBP (On Base Percentage)
This formula measures the on base percentage recorded by a player. It measures how often the player reaches the base, as long as this has not been caused by an error of another player.
OBP=(H+BB+HBP)/(AB+BB+HBP+SF)
Where:
- H: Hits
- BB: Base on balls
- HBP: Times hit by pitch
- AB: At bat
- SF: Sacrifice Flies
- TB: Total Bases (1 for simple, 2 for double, etc).
- IP: Innings pitched
- K: Strikeouts
RC (Runs Created)
This is a Bill James statistic contribution to estimate the number of runs a hitter contributes to his team.
RC=((H+BB) TB)/(AB+BB)
FIP (Fielding Independent Pitching)
This formula created by Tom Tango, measures the effectiveness of a pitcher based on work done by him alone, without involving fielders. Percentages are only considered under the control of the pitcher.
FIP=(13HR+3BB-2K)/IP+3.10
These statistics and many others based on formulas such as TA (Total Average), PCT (Total Career Player), BOP (Base Out Percentage), include some already established formulas and others developed or adapted for the use of particular teams; these statistics are used to evaluate the performance of the players. All these are metrics designed to obtain relevant information from a repository as large as that generated by 750 players per season, divided into 30 teams, each with 162 games per season, plus minor league players or foreign leagues, pre-season games, and intrinsic information of the game or its environmental (such as weather or time).
In a sabermetric analysis, every aspect that involves the player being evaluated is included. That is the physical qualities of the players, their percentages in the past and the economic contribution that the player can mean for the team. However, since many years of average measures have been used to evaluate baseball players, what sabermetrics looks for is to include those factors that might make a difference in this performance.
After taking the performance indicators for each player, several methods can be used to find the combination of players that would give the team the best results. An example is the “pythagorean theorem of baseball,” which determines how many games won or lost can change if a certain player is traded to another team. This is based on the contribution that the player had in the team’s wins last season.
Regression analysis can be used to show the weight that each variable has on the optimal outcome of the equation. If what is sought to predict is the number of runs the team will create, what must be found is the combination that best describes the importance that a given variable has in the equation.
Another method to asses different combinations is Monte Carlo simulation, which consists in simulating a situation using a computer to generate possible outcomes. The great advantage that these simulations provide to baseball is the ability to predict a result from a combination of events with a probability assigned; in addition to the performance of the players, factors such as climate can also be included.
After hiring Bill James in 2002, the Boston Red Sox won the pennant in 2004 (after 86 years without success) to conquer it again in 2007. Like the Red Sox, many other teams today use statistics as a tool to improve their sports performance.
Given the important contribution that statistics provides to the sport, not only baseball uses it for decision making, but an increasing number of sports teams are now considering the statistical history of their players to assess the contribution that these would have on its strategy. However, not all people involved in sports consider sabermetrics a formula for success. This opinion is based on, that although several teams have adopted this method to efficiently improve their results, the variation contributed by the players as human beings prone to physical, psychological or mood factors make a difference between the result proposed by the formulas and real outcome.
Considering both perspectives and the contribution that statistical analysis can bring to sports, the balance between experience and the use of analytical methods for decision making would be the ideal combination for best results. As in sports, any business or organization can do more than to grow in knowledge in order to grow in intelligence. Hence, business intelligence, which through statistics and metrics seeks to create value for the billions of terabytes of information in distributed servers around the world.
References:
Moneyball. Dir. Bennett Miller. Sony Pictures, 2011.
Merriam Webster Dictionary. http://www.merriam-webster.com/dictionary/sabermetrics
Francisco Merejo, “Historia de la Sabermetría”.
Gabriel B. Costa, M. R. (2008). Understanding Sabermetrics: An Introduction to the Science of Baseball Statistics. McFarland.
Winston, W. L. (2009). Mathletics. Princeton University Press.
* Tangotiger. (2011). Payroll v Wins, in the Moneyball era (2002-2011). http://goo.gl/xAgI1.